

Ash Potterton at Arrow Media on bringing the data component in stories to life in on-screen graphics
Every hour of every day, our digital devices are capturing a story about us. Each interaction is registered and recorded – and even not using a device reveals insights into our own pattern of life.
For detectives, this digital record has become a key aspect of major crime investigations, because while witnesses can sometimes be reluctant to talk, data is fearless. A digital trail can reveal crucial insights into a victim’s behaviour or provide leads to help identify and track down a suspect.
In its rawest form, digital data is just a sequence of codes. The challenge for programme-makers is how to turn these into compelling visual material.
Season 2 of Arrow Media’s Investigation Discovery series Caught in the Net presented this challenge eight times over, with eight different murder investigations. We wanted to push the boat out even further from Season 1 and tell a range of stories that illustrated how data has become so integral to our lives.
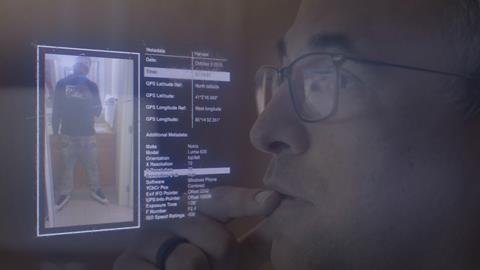
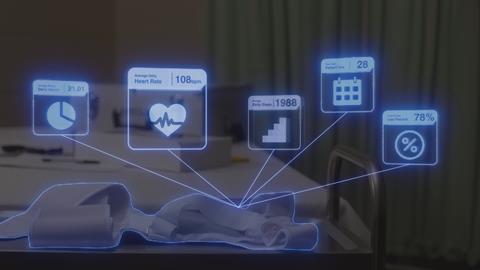
This season’s stories included investigations where detectives try accessing data from the victim’s heart rate monitor to pinpoint her time of death; mining EXIF data embedded in smartphone photos to identify their location and track down a suspect; and digitally unpicking a mass brawl on Facebook, which someone had livestreamed without even knowing they were recording a murder.
In order to achieve this, graphics had to be central to our storytelling plans from the get-go. Fortunately, we were able to reunite with graphics company Revenant who did an outstanding job on the first season of Caught in the Net.
Right from the formative stages of story planning, our top priority was to zero in on key digital turning points in the investigation and structure the narrative around them. The focus then switched to envisaging graphics sequences to illustrate them and, crucially, bring the data component to life.
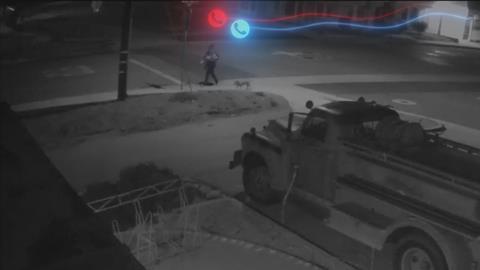
Leveraging Revenant’s expertise gave us huge creative flexibility – for example, overlaying the victim’s heart rate data on lobby CCTV to identify when her killer entered the building; layering on reams of metadata to illustrate the EXIF data embedded in the smartphone photos; and replicating how a video analysis program called iNPUT-ACE was used to create enhanced viewing perspectives of the Facebook Live brawl footage that detectives had watched dozens of times without a breakthrough.
The ghostly, spectral feel of the graphics helped generate an unsettling feeling and became a visual motif of the series. But for graphics to look compelling is one thing – for them to feel compelling is another thing entirely.
It was vital the graphics helped deliver emotional heft. These were incredibly powerful stories and we focused on ensuring that for every graphic the emotional stakes were clear, because ultimately, each data sequence gets detectives one step closer to securing justice for victims and their families. And when we felt the significance of that breakthrough resonate in the edit suite, we knew we’d succeeded in bringing the data to life.
Caught in the Net 2 launched on ID on 13 September and airs 10pm weekly.

Ash Potterton is executive producer at Arrow Media


No comments yet