

Combination of event data and tracking data to bring new insights for broadcasters and more
Stats Perform has announced the launch of Opta Vision for the 2022/23 football season.
Opta Vision marks the first time that Stats Perform’s Opta event data has been combined with tracking data - which comes from sources including stadium feeds from camera systems installed at match venues and, for the first time, remote tracking collection from video sources.
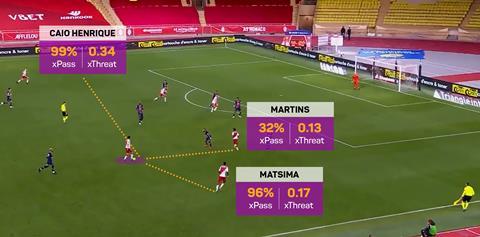
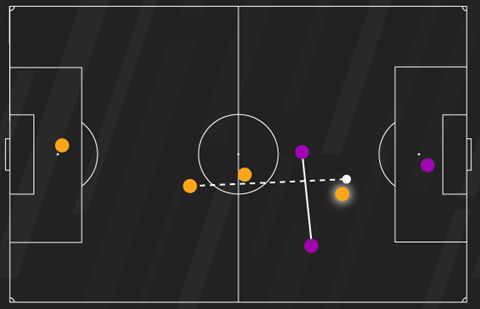
Stats Perform’s Qwinn AI Intelligence is used to gain new insights from the merged data, including insights related to dynamic changes in a team’s shape during a match; as well as various pass prediction outputs that are trained on millions of data points that consider the movement of attacking and defending players in the moments leading up to a pass.
Stats Perform Senior Product Manager Jens Melvang explained: “In the past, how we looked at data was very isolated. So, you were looking at the events in a certain way, but you were lacking the position of the players. You didn’t really know the context of the game, what phase it was in, and so on.
“Then, on the other side, the tracking data was mostly used to describe the physical effort, the workload of the players, and mostly used by the fitness coaches to get an idea of whether they’re pushing to the limit, risking injury, or optimising performance. Those were the two typical use cases.
“What we’re doing now is we are merging these two, so we get the tactical information included in the syllabus, or in these data points. And then suddenly, you can do a lot of things that are very interesting.”
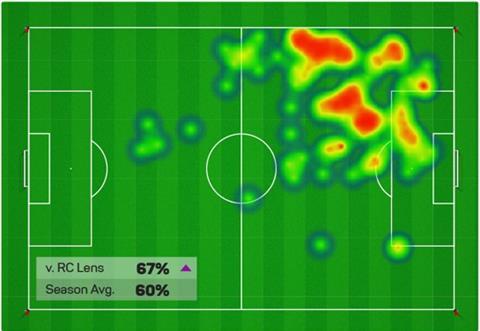
Melvang gave an example: “There are theoretical player positions, which you already see before the match, but when you actually look at where they actually position themselves during the match, it’s very different. You see very different structures. We have some really good examples of that. We can also show whether team structure is different when defending or attacking.”
Other new metrics include the detection of pressure intensity for every pass attempted in a match and a new qualifier on passes to indicate when a player completes a line-breaking pass. Both outputs will be available live to customers for several top-flight European Leagues, providing greater context to key events and helping deliver a more precise picture to customers as to what is happening during any given game.
However, this is just the tip of the iceberg with the merged data, according to Melvang, who promised that there will be more to come in the future: “There are a lot of different avenues that we are looking at. One of the things that we’re currently looking into is different ways of showing pressuring styles…it’s one of these things that is used a lot by the coaches, but it’s not really tangible yet. We need some numbers on it, to really understand what it means.”
There is a wide range of uses for broadcasters, as either a first or second screen experience, including bringing more depth to coverage, keeping fans interested in the game, and moving punditry to a new level. As Melvang explains, pundits could now ask “what if?” rather than “what happened?”
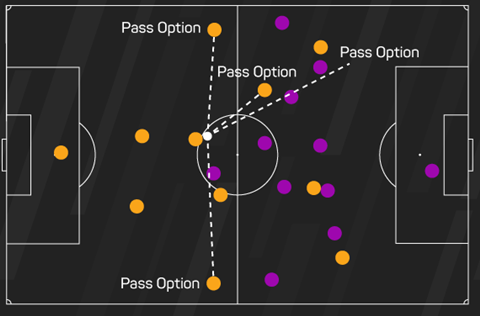
“In the past, it was very much descriptive, it was about, ‘this was what happened’, and we talked about that. Now it will be what could have happened. The likelihood of if they have done that, would that actually give them a better chance of scoring? If the pass had been to this guy instead of that guy, then would the likelihood of scoring be bigger?”
He added: “Instead of just having subjective suggestions, we have some numbers and probabilities to back it up. It is not just an opinion, it’s something that can actually be measured. This pass would have led to a 50% chance of getting to a shot, whereas this pass lead to a 20% chance of getting to a shot. It’s something concrete. Then you can, of course, discuss in more detail.
“I think it opens up new avenues of how to have a discussion around the game. The different takes, it’s an underlying narrative that you don’t really see. There will be something tangible around the discussion.”
Overall, Melvang is confident that Opta Vision will bring supporters closer to the game than ever before: “That’s key. They will have a much better grasp of the information.”
He continued: “It makes the game more interesting. When you peel off more layers and you get a better understanding of what’s happening, it becomes more interesting. It could become the focal point of the debate.
“There’s something tangible, something that you can really rely on to relate to. It could be the departure point, and fans will think it’s more interesting because they get more knowledge about the game. It gets a little closer to what the coaches actually think about the game, the different decisions they have to make and so on. So the supporters get a little closer to the game.”
This is a sponsored article.


No comments yet